
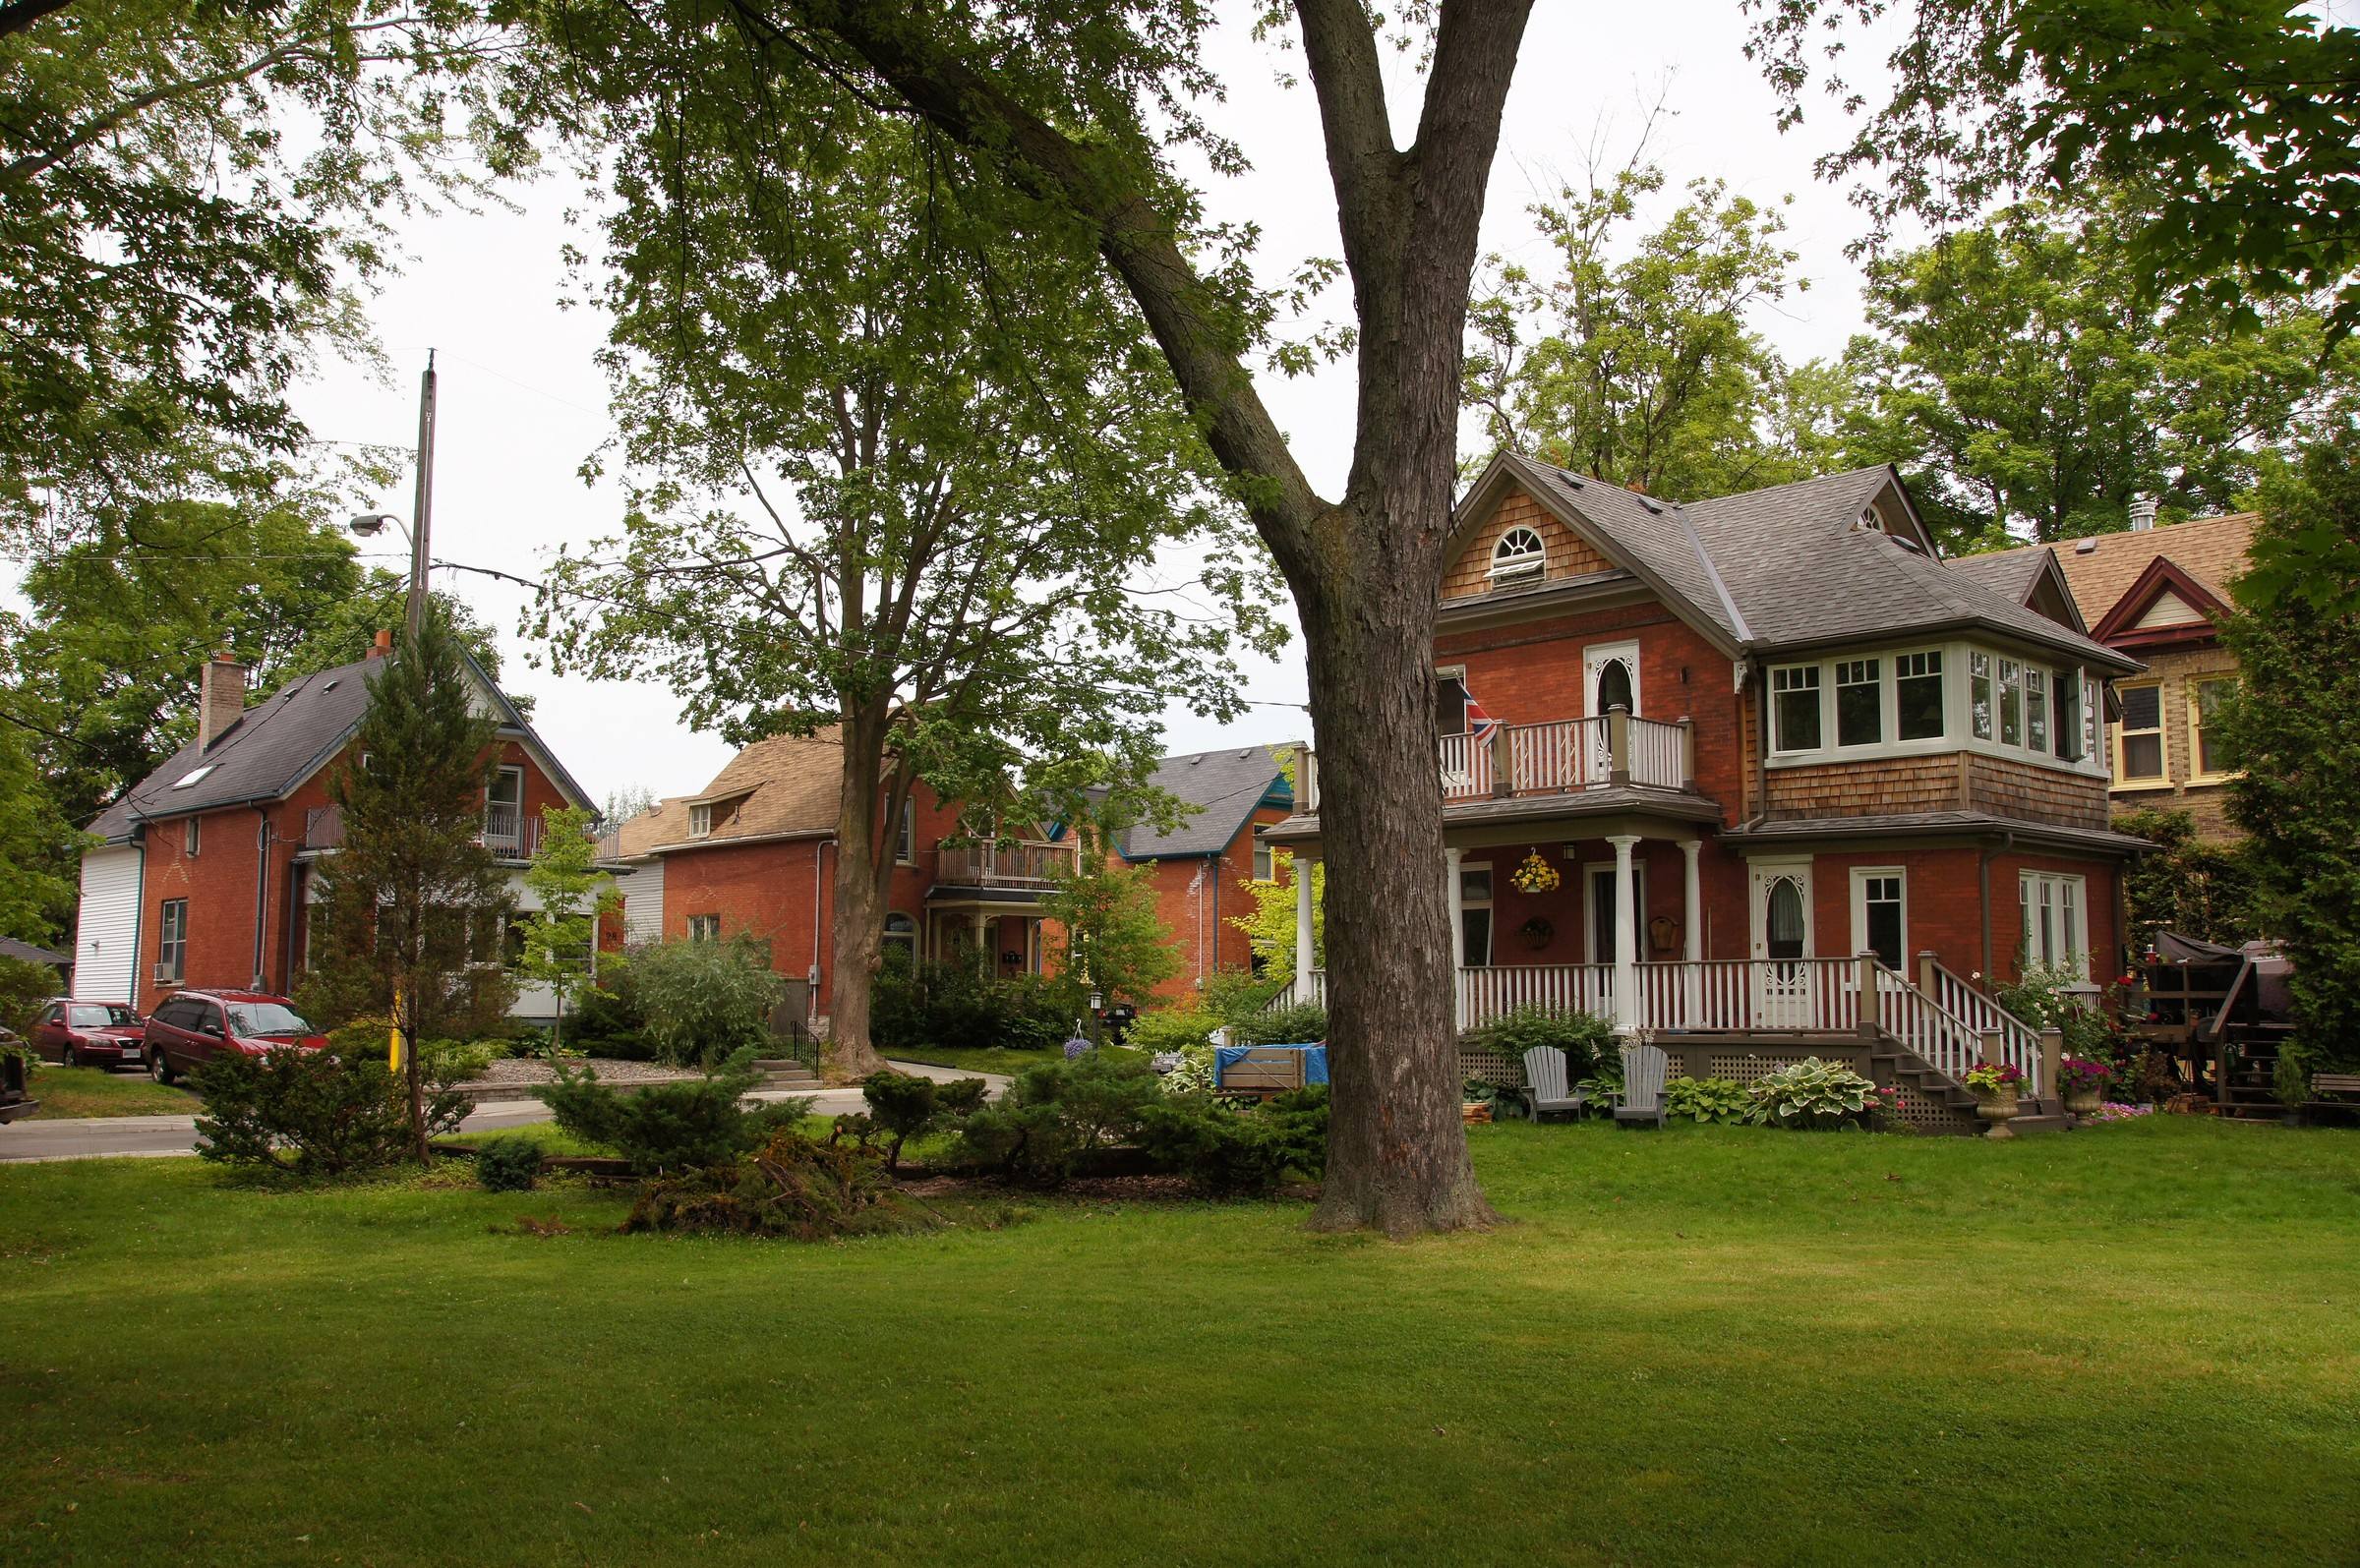

- Average sale price, Kitchener
- $664,950 (down 1.9% in a year)As of October 2026.Source
- Kitchener sales, and change from October 2025
- 203 (down 17.8%)As of October 2026.Source
- Months of supply and days to sell, Kitchener
- 3.9 months, 31 daysAs of October 2026.Source
- Population of Kitchener, and growth since 2016
- 256,885 (up 10.1%)As of 2021 Census.Source
On this page
Kitchener is the value end of Waterloo Region. It costs less than Waterloo or Cambridge, it has more homes on the market, and the numbers that matter to a second mortgage shift from month to month.
Kitchener’s $664,950 average and 3.9 months of supply
As reported by ViewHomes, citing the Cornerstone Association of REALTORS and ITSO data, Kitchener had 203 sales in October 2026, down 17.8% from a year earlier. The average sale price was $664,950, up from $646,426 in September and down 1.9% year over year. Homes took 31 days to sell, up 10.7%. New listings fell 9.3% to 529, and supply was 3.9 months, the highest of the region’s three main cities.
Across Waterloo Region 489 homes sold at an average of $718,851, and the region had 3.7 months of supply, the tightest of Cornerstone’s major market areas. Kitchener, at 3.9 months, is a touch looser.
Kitchener counted 256,885 residents in 2021, up 10.1% from 233,222, inside a Kitchener, Cambridge and Waterloo census metropolitan area of 575,847.
Why the region’s cheapest city has the thinnest margins
Kitchener’s average sits $36,156 below Cambridge’s $701,106 and $69,543 below Waterloo’s $734,493. Lower values mean fewer dollars of equity for a given first mortgage, and fewer dollars under a lender’s ceiling. A 5% fall on $664,950 is $33,248 of value, and 80% of that is $26,598 of room.
Kitchener homes also sell a little more slowly than Waterloo’s 28 days. Lenders note both facts, and neither helps a borrower who is already near the limit.
How far room moves between two months’ averages
The 80% limit from the Financial Consumer Agency of Canada leaves less room than most owners expect. In the first example, an owner at the average price with $430,000 owing has $101,960 of room. The second shows how much the room can move when the value used moves from September’s average to October’s: $14,819.
Averages are crude. They describe whatever sold in a month, and that is why a lender orders an appraisal on your home alone. Still, the lesson holds: do not plan a loan to the last dollar. Test your numbers on the calculator.
Kitchener inside the region
Waterloo Region’s October 2026 report shows 489 sales, so Kitchener’s 203 were about 42% of the total. Regional new listings fell to 1,025 from 1,232 in September, 17.3% fewer than a year earlier, which is why supply kept tightening even as Kitchener’s own listings fell only 9.3%.
The regional average was $718,851, down 1.3%. Kitchener’s $664,950 is $53,901 below it. If you read a regional headline about Waterloo Region prices, remember that Kitchener sits under the number and Waterloo above it.
Sales speed in the region
Kitchener homes took 31 days to sell in October 2026, up 10.7% from about 28 a year earlier. Waterloo took 28 days, down 24.3% from about 37, and Cambridge took 34, up 17.2%. A lender thinking about resale sees Kitchener in the middle of the three, selling more slowly than Waterloo and faster than Cambridge.
Fees, and the other routes to price first
Land transfer tax applies when property is bought, and we found no such line for registering a second mortgage on a home you own. Expect the lender’s fee, a broker fee, legal costs, an appraisal and the registration fee, itemised on the Ontario page.
If the loan is for debt, the consolidation page shows how fees can erase a first year of savings. If your income is hard for a bank to count, see self-employed second mortgages. If credit is the barrier, read second mortgages with bad credit.
The wider arrears picture
CMHC’s October 27, 2026 release says Ontario’s arrears were 0.32% in the second quarter of 2026 and will keep rising through mid-2027, mostly in the Greater Toronto and Hamilton Area and southwestern Ontario, with trade pressure on manufacturing, automotive included, cited as a driver. It names no cities, so we cannot say whether CMHC counts Kitchener in either region, and it gives no Kitchener figure.
A licence check for a Kitchener quote
Ontario private lenders sit behind Level 2 agents and brokers. Look up the licence number on the FSRA register before you share documents.
Once your Kitchener figures are drafted, have a licensed professional review them. Compare the neighbouring Waterloo and Hamilton pages.
A Kitchener home at the October 2026 average with $430,000 owing
The $664,950 value is the October 2026 average sale price for Kitchener, from data republished from the Cornerstone Association of REALTORS, used as a stand-in for an appraisal. The $430,000 first mortgage and $55,000 loan are made up. The 80% ceiling is the one the Financial Consumer Agency of Canada describes.
- Home value used
- $664,950
- 80% of the home value
- $531,960
- Room under the ceiling
- $101,960
- Combined loan-to-value with a $55,000 loan
- 72.9%
- Room left after the $55,000 loan
- $46,960
$664,950 times 0.8
$531,960 minus $430,000
$485,000 owed on $664,950
How a one-month swing in Kitchener's average changes the room
Kitchener's average sale price was $646,426 in September 2026 and $664,950 in October 2026, per the same data. Neither is an appraisal and the two are used only to show how a shift of this size moves the ceiling. The $500,000 first mortgage is made up.
- 80% of the September average
- $517,141
- Room using the September average
- $17,141
- 80% of the October average
- $531,960
- Room using the October average
- $31,960
- Difference in room between the two months
- $14,819
$646,426 times 0.8, rounded
$517,141 minus $500,000
$664,950 times 0.8
$531,960 minus $500,000
Questions people ask
By how much does Kitchener undercut Waterloo and Cambridge?
In October 2026 Kitchener averaged $664,950, against $701,106 in Cambridge and $734,493 in Waterloo. That is $36,156 below Cambridge and $69,543 below Waterloo. These are all-type averages and say nothing certain about a specific home.
Why does Kitchener's higher supply matter if I want to borrow?
More months of supply, 3.9 in October 2026, means buyers have more choice and homes take 31 days to sell. A lender weighing resale may be a little more careful. Your appraisal and your first mortgage still decide the amount.
Did Kitchener's average price change much from September to October 2026?
It rose from $646,426 in September to $664,950 in October, which is $18,524. Monthly averages move with the mix of homes sold, so do not read it as a trend. Use a current appraisal for your own house.
Is Kitchener's population growth likely to keep values up?
It may help demand, but it is not a guarantee. Kitchener grew 10.1% between the 2016 and 2021 censuses, while sales in October 2026 were 17.8% lower than a year earlier. Lenders look at current comparable sales.
Sources
- As reported by ViewHomes, citing Cornerstone Association of REALTORS and ITSO data: Kitchener, Waterloo and Cambridge market statistics, October 2026, 2026-11
- Statistics Canada: Focus on Geography Series, 2021 Census, Kitchener
- Financial Consumer Agency of Canada: Borrowing against your home equity
- CMHC: Ontario mortgage arrears expected to rise through mid-2027, October 27, 2026, 2026-10-27